Excel 2000
Creating a Chart
Creating an Embedded Chart
Embedded charts are charts that reside on the same worksheet as the source data.
To embed a chart in a worksheet:
- Choose View
 Toolbars
 Chart.
- Select the range of cells that you want to chart. Your source data should include at least three categories or numbers.
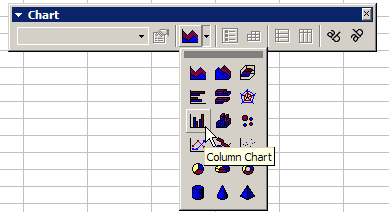
- On the chart toolbar, click the chart type pull down and select the chart that you would like to use.

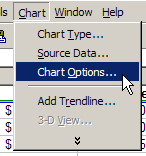
- To add a title to your chart, open the chart options dialog box: Chart
 Options.

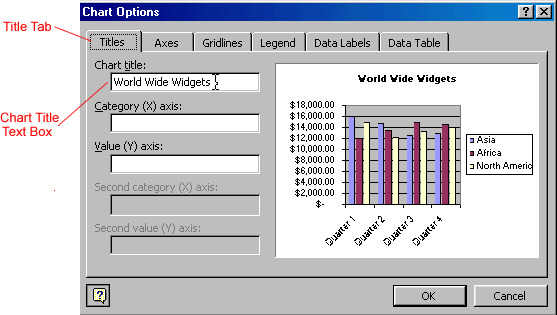
- Select the titles tab and enter your title in the Chart Title text box.

![]() Keep in mind that different charts will work best with different data. For example, a pie chart can only display one data series at a time.
Keep in mind that different charts will work best with different data. For example, a pie chart can only display one data series at a time.


